Jvm Stuck Threads
Published: 2025-01-26
Symptom
On a Tomcat/JVM application designed to run as multiple instances across several servers behind a load balancer, we noticed an issue after monthly patching. Following server and application restarts, a few days would pass before certain instances began exhibiting unusually high CPU usage at random.
Typically, each application instance on a single server would operate within a CPU usage range of less than 1% to 2%, with occasional spikes during expected application activity—normal behavior for Windows applications and executables. However, after patching, we observed instances becoming 'stuck' at around 25% CPU usage.
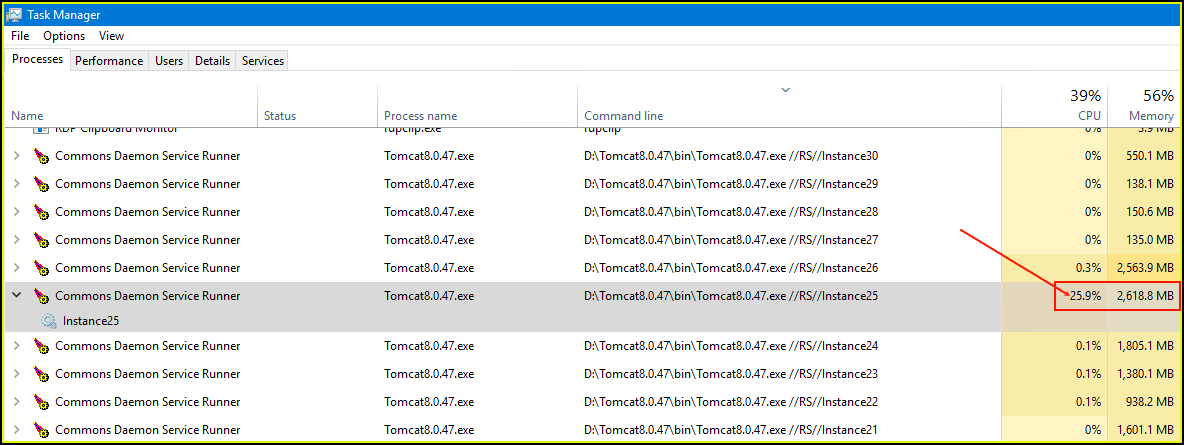
Detailed View
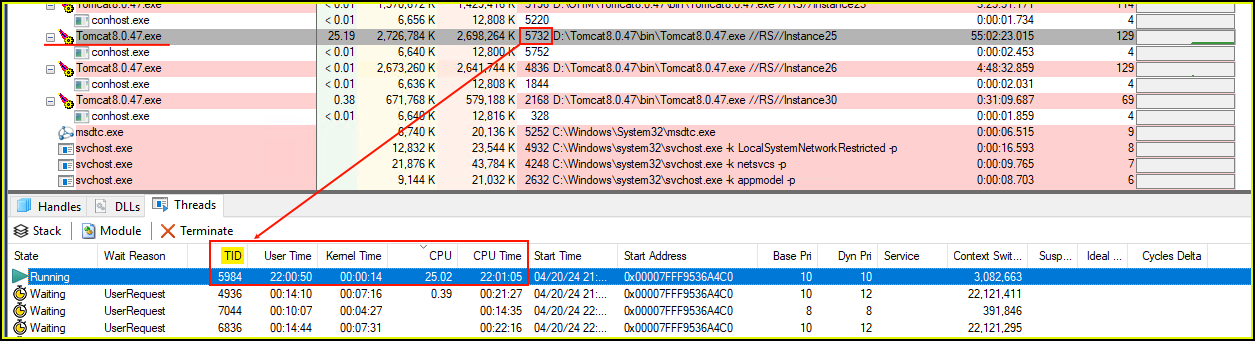
The screenshot below highlights the Tomcat process (ID 5732) and one of its threads (ID 5984). The significantly higher CPU time indicates that the thread had been stuck at this usage level for an extended period and, as our testing confirmed, it would remain in this state indefinitely.
More Information
PowerShell Monitoring
To gain a better understanding of why, it was important to determine when. For this, a PowerShell script was written using WMI to monitor when these threads would become 'stuck'.
A more complete code for this can be found here: Thread Monitor
1 2 3 4 5 6 7 8 9 10 11 12 13 14 15 16 17 18 19 20 21 22 23 24 25 26 27 28 29 30 | |
Thread Information
Digging deeper we needed to understand what the thread within the Tomcat process was doing. For this we used a tool called jstack to get a thread dump of the exe.
With an ID of 5732 the command looked something like this:
1 | |
Sample output of jstack:
1 2 3 4 5 6 7 8 9 10 | |
The Native ID
Looking through the output of jstack we saw all the threads, but to determine which was the one running the CPU core to 100%, we needed to convert the nid or Native ID from hex to decimal.
This was done by taking all the nid's and using Excel to convert them all at once.
Eventually, we determined that nid 0x1760 corresponded to thread id 5984. The stuck thread was a C2 compiler thread.
1 2 | |
Problem
What Is A C2 Compiler?
The C2 compiler, also known as the Java HotSpot Server Compiler, is one of the Just-In-Time (JIT) compilers used in the Java Virtual Machine (JVM). It is designed to compile Java bytecode into highly optimized native machine code to maximize performance during runtime.
The JVM decides when to compile code based on runtime profiling data collected about the behavior of the application. This decision-making process revolves around the concept of hotspots, where the JVM identifies methods or code paths that are executed frequently or are performance-critical.
Something In The Code
There must be something (hotspot code) within the application source that causes the compiler to hang when it tries to optimize it further.
A Solution
How The App Is Started
The Java Virtual Machine (JVM) has a wide range of parameters that allow control of its behavior. From memory management, to garbage collection, debugging, and many other settings to fine-tune performance.
Here is a sample:
1 2 3 4 5 6 7 8 9 10 11 12 13 14 15 16 | |
Skip C2 compilation
The ideal solution would be to try and determine what exactly is causing the hangup and exclude it from compilation. It can be time consuming and difficult to trace down to the exact code. However, if the offending item can be determined it can be excluded from optimization by using a startup parameter string similar to the one outlined below.
XX:CompileCommand=exclude,com.graphhopper.coll.GHLongIntBTree::put
Other options include limiting or disabling aggressive optimizations, reducing the number of active JIT compilation threads, limiting method inlining, or turnning off C2 compilation all together.
In this particular instance we chose to turn off C2 compilation. Since there are multiple levels and the thread dump never showed C1 compiler threads getting stuck, we felt that full C1 compilation was enough and easy to test and implement.
The levels of compilation are as follows:
- 0 Interpreted code
- 1 Simple C1 compiled code
- 2 Limited C1 compiled code
- 3 Full C1 compiled code
- 4 C2 compiled code
After months of testing and piloting on a few chosen production instances and verifing no ill effects to the end-user, we were confident in our solution, and implemented it on all our instances.
By using the -XX:TieredStopAtLevel=3 parameter we were able to stop JIT compilation at level 3 and continued monitoring showed no stuck threads and the application runtime was more stable.